Trajectory Cluster Climatology |
||
Home |
18 Jan 2026 | |
This page describes an approach used to determine if there is a long-term trend in trajectory climatology using cluster analysis as the basis of the evaluation. The underlying assumption is that a flow-based kinematic trajectory can represent air mass movements and their persistence. The tables and graphics are pre-computed and summarize the cluster analysis for each of seven decades of trajectories from 612 locations over the globe. The trajectories are 48 hour backward isobaric calculations and use the NCAR-NCEP global reanalysis meteorological data. More detailed information about the trajectory and clustering methods is provided here. A cluster analysis by decade for each trajectory origin location is used to determine the upwind flow patterns. The resulting cluster mean trajectories were sorted into eight clusters for each decade. A graphical summary of the global results is represented by the five figures shown below.
- Cluster Duration
- Cluster Origin Temperature
- Cluster Origin Pressure
- Cluster Origin Moisture
- Cluster Origin Wind Speed
- Trajectory Cluster Statistics by Location
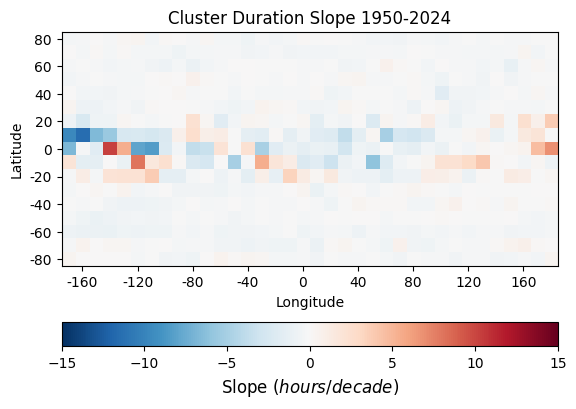
One example of how one might interpret the cluster climatology results can be illustrated by the global map of the change in cluster durations shown as the regression slopes of the average cluster duration by decade at each location. Values represent the average change in the persistence over all clusters. The persistence is defined as the average number of hours that sequential trajectories will stay in the same cluster. Locations with the warmest colors show a positive trend of increasing duration over the last 75 years. Although there is no obvious global trend in the cluster durations, the largest changes in duration, both positive and negative, some adjacent to each other, are centered over the tropical regions, especially in the eastern Pacific at 0N between 150W and 140W. An examination of the decadal trends at those locations shows very large variabilities in duration between decades and some of the longest durations of any location are associated with a single dominant cluster.
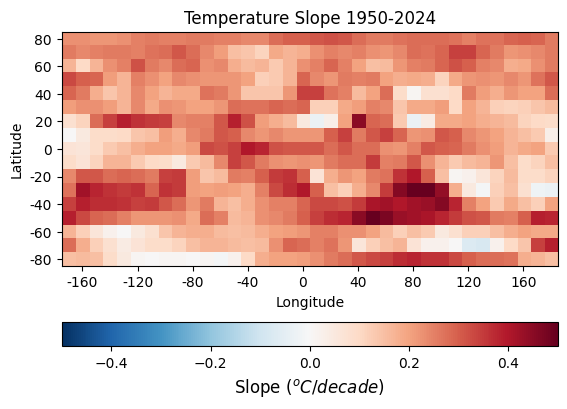
Another global view would be the change in temperature at the trajectory origin point. The overall global trend is positive with some of the largest changes in the southern hemisphere. Because the trajectories all originated at 1500 m AGL, temperature changes are expected to be more damped compared to those at the surface. The largest positive change occurs at 30S 90E off the coast of western Australia. A slight cooling is notable near 70S 120E along the Antarctica coastline. A closer look at the decadal trend at that location suggests the trend is within the range of decadal variability and not significant.
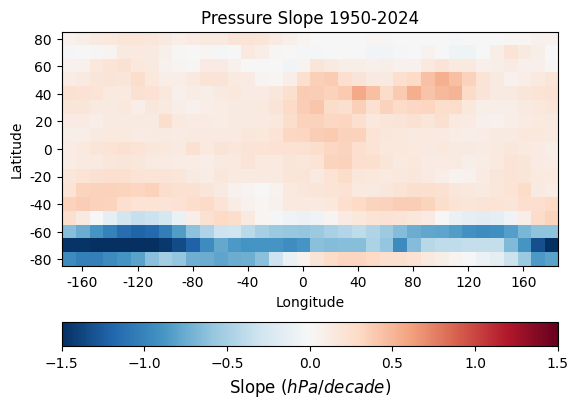
This graphic shows the change in the atmospheric pressure at the trajectory origin point. Changes to atmospheric pressure at 1500 m AGL represents changes in the mass of the atmosphere above that level. Therefore, a decrease in pressure means there is more mass below 1500 m presumably due to an increase in density and a corresponding decrease in temperature. Therefore, this may be a more reliable indicator of climate change as it represents a layer average. The graphic indicates the globe is dominated by increasing pressure and therefore temperature. However, there is a large region of decreasing pressure across the Southern Ocean and along the Antarctica coastline. For instance, the location 70S 120W shows a pressure decrease of 12 hPa over the 75 year period. The cooling trend was not so obvious in the previous temperature trend graphic.
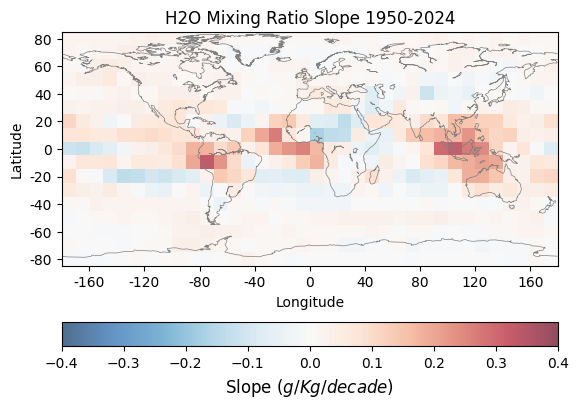
The graphic shows the change in the atmospheric moisture at the trajectory origin point. Moisture is shown as the water vapor mixing ratio which is the weight of water to dry air (g/Kg). Moisture can be highly variable and the measurements included in the meteorological data during earlier decades may be unreliable. Nevertheless, the results for all seven decades are presented here for completeness. For instance, the location 0N 110E shows a moisture increase of about 2 g/Kg over the 75 year period.
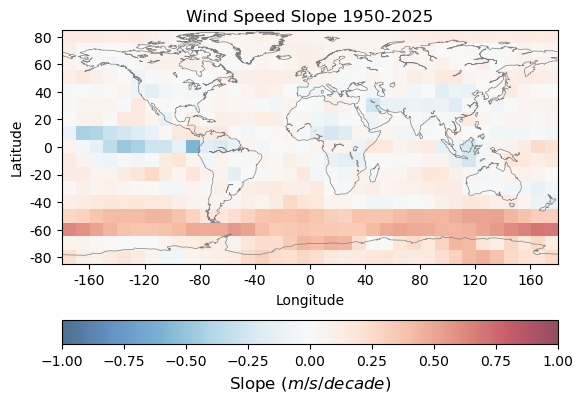
This last graphic shows the change in the wind speed at the trajectory origin point. Two regions seem more significant than the others. There is a large region of increasing wind speed across the Southern Ocean and along the Antarctica coastline on the order of 0.5 m/s per decade. The other area is along the tropical eastern Pacific where there is a decrease on the order of 0.5 m/s per decade. These decreasing winds might be interpreted to have some effect on the frequency of ENSO events.
The previous graphics showing average trends could have been generated without
the use of trajectories. They are presented only to determine if there are any
locations that require a more detailed examination. The linkage of trajectory
analysis with the cluster mean temperature, pressure, and moisture, provides
the opportunity to determine if trends in those variables are due to changes in
those values or changes in the frequency of air flow from different regions. This
can be very location specific. To examine the trajectory cluster climatology
archive at selected locations: