 |
|
Cluster Analysis using HYSPLIT Trajectories
|
Examining the Global Clusters by Location
The tables and graphics generated on this page are for a specific location
rounded to the nearest 10 degrees of latitude and longitude. The data convention
is that negative values are for South and West.
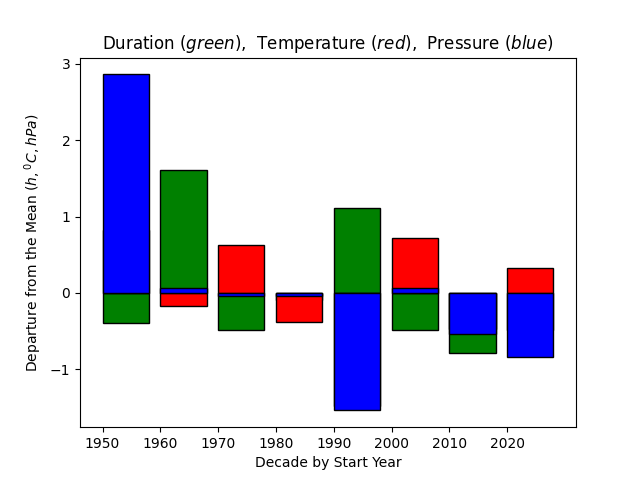
The topmost graphic next to the data entry for the trajectory origin point
summarizes the decadal trends as a departure from the 75 year mean for the cluster
persistence, origin temperature,
pressure, moisture,
and wind speed.
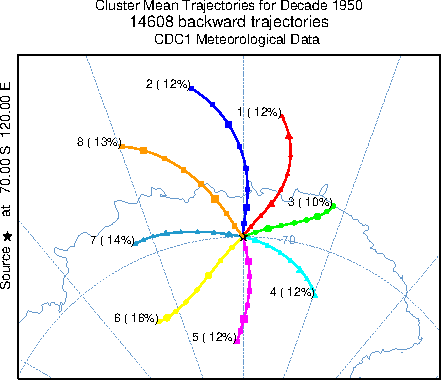
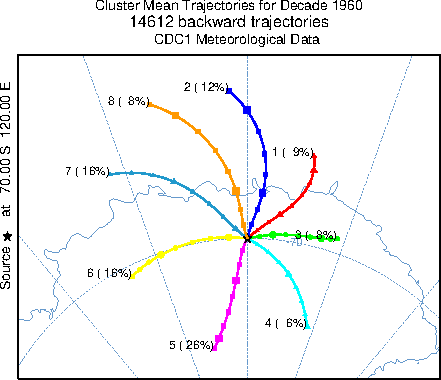
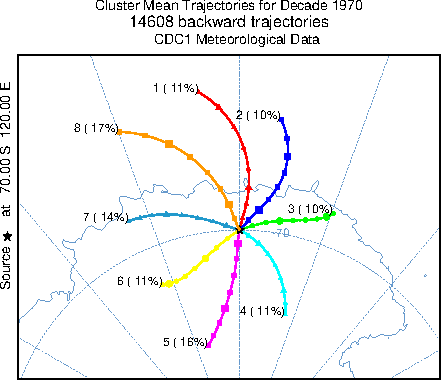
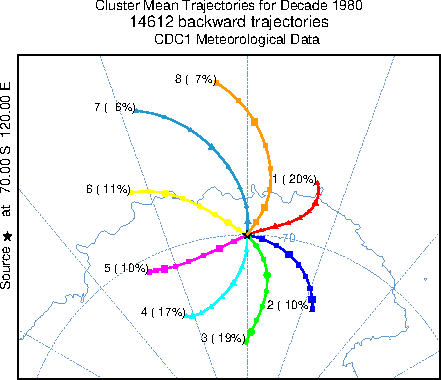
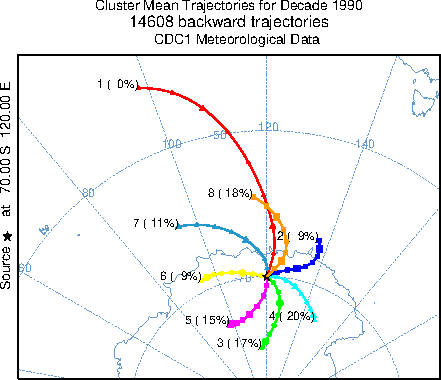
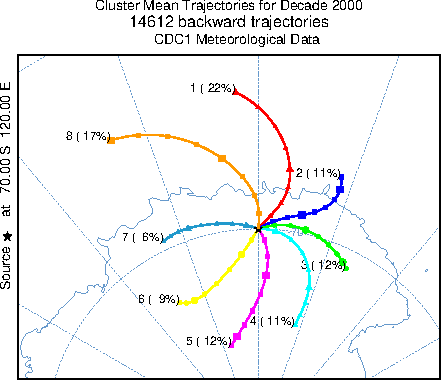
The trajectory graphic for each decade shows the mean trajectory for each
cluster. Because the clustering process averages trajectories together that have
the least spatial variance compared to all other trajectory pairs examined,
slight differences in flow patterns may cause the cluster mean trajectories
identified by the same cluster ID number to have different upwind origins
each decade. Below each graphic is a link to the HYSPLIT formatted trajectory
endpoints file used to generate the graphic.
The tabular results by decade are shown after pressing Update.
Two tables are presented for a location.
The first table shows the means by cluster number,
the percent of the trajectories in that cluster, and the average duration
of the cluster. The duration is defined as the number of sequential
trajectories that have the same cluster number, a measure of the persistence
of the flow pattern. Each cluster lists the average temperature,
pressure, moisture, and wind speed, at the backward trajectory
origin point, which is sometimes called the forward trajectory endpoint.
The last row lists the decadal mean for each quantity.
The second table for each decade tabulates the rate of change per day for
each of the meteorological variables along the cluster
mean trajectory using linear regression. For example, a positive rate of change
for temperature would indicate that temperature at the upwind trajectory
endpoint is warmer that the average value tabulated at the origin point
in the first table .
 |
Positions are internally rounded to the nearest 10 degrees.
|
Cluster Mean Trajectory File | Means 1950 through 1959 at 70S 120ECluster
Numb | Percent
| Duration
(h) | Temp
(oC) | Press
(hPa) | H2O
(g/kg) | Wspd
(m/s) |
|---|
�
1 | 12.5 | 24.5 | -28.6 | 594.3 | 0.5 | 6.4 | �
2 | 11.7 | 20.4 | -30.2 | 592.0 | 0.4 | 7.4 | �
3 | 9.9 | 25.3 | -26.6 | 596.6 | 0.6 | 6.0 | �
4 | 11.7 | 29.4 | -27.5 | 595.5 | 0.6 | 6.2 | �
5 | 12.1 | 23.1 | -30.6 | 590.6 | 0.2 | 6.5 | �
6 | 15.6 | 25.6 | -32.0 | 588.3 | 0.1 | 8.9 | �
7 | 13.5 | 19.8 | -32.9 | 586.3 | 0.1 | 8.4 | �
8 | 13.1 | 19.5 | -32.1 | 588.6 | 0.3 | 8.0 | �
Mean | 100.0 | 23.1 | -30.3 | 591.2 | 0.3 | 7.4 |
|
Along the trajectoryCluster
Numb | Temp
(oC/d) | Press
(hPa/d) | H2O
(g/kg/d) | Wspd
(m/s/d) |
|---|
�
1 | 3.60 | 9.41 | 0.24 | 2.46 | �
2 | 3.86 | 6.42 | 0.24 | 3.35 | �
3 | 2.17 | 8.72 | 0.11 | 0.55 | �
4 | 0.26 | 5.13 | 0.03 | 0.11 | �
5 | -3.25 | 5.76 | 0.03 | 0.11 | �
6 | -4.41 | 3.28 | 0.03 | -0.87 | �
7 | 0.82 | 4.46 | 0.08 | 0.07 | �
8 | 3.62 | 7.65 | 0.22 | 2.50 | | | | |
|
Cluster Mean Trajectory File | Means 1960 through 1969 at 70S 120ECluster
Numb | Percent
| Duration
(h) | Temp
(oC) | Press
(hPa) | H2O
(g/kg) | Wspd
(m/s) |
|---|
�
1 | 8.9 | 22.7 | -27.0 | 594.4 | 0.6 | 5.8 | �
2 | 12.3 | 23.8 | -29.5 | 592.1 | 0.5 | 6.8 | �
3 | 7.6 | 27.1 | -27.3 | 593.4 | 0.6 | 5.6 | �
4 | 6.2 | 20.5 | -31.5 | 588.2 | 0.2 | 5.6 | �
5 | 25.6 | 41.2 | -31.9 | 586.8 | 0.1 | 7.1 | �
6 | 15.7 | 22.8 | -34.1 | 583.9 | 0.1 | 9.5 | �
7 | 15.6 | 21.2 | -33.4 | 586.4 | 0.2 | 8.1 | �
8 | 8.1 | 14.0 | -31.4 | 589.7 | 0.3 | 7.2 | �
Mean | 100.0 | 25.1 | -31.3 | 588.4 | 0.3 | 7.3 |
|
Along the trajectoryCluster
Numb | Temp
(oC/d) | Press
(hPa/d) | H2O
(g/kg/d) | Wspd
(m/s/d) |
|---|
�
1 | 2.97 | 11.17 | 0.20 | 1.44 | �
2 | 3.66 | 6.80 | 0.21 | 3.01 | �
3 | 1.04 | 4.64 | 0.05 | 0.31 | �
4 | -0.37 | 5.75 | 0.03 | 0.84 | �
5 | -4.46 | 5.04 | 0.02 | -0.08 | �
6 | -0.81 | 3.08 | 0.04 | -0.63 | �
7 | 3.29 | 7.89 | 0.17 | 2.12 | �
8 | 3.67 | 6.30 | 0.21 | 3.44 | | | | |
|
Cluster Mean Trajectory File | Means 1970 through 1979 at 70S 120ECluster
Numb | Percent
| Duration
(h) | Temp
(oC) | Press
(hPa) | H2O
(g/kg) | Wspd
(m/s) |
|---|
�
1 | 11.3 | 19.2 | -29.5 | 591.0 | 0.4 | 7.0 | �
2 | 10.2 | 22.1 | -27.7 | 593.4 | 0.6 | 7.0 | �
3 | 10.3 | 30.8 | -26.1 | 594.8 | 0.7 | 6.7 | �
4 | 11.1 | 27.1 | -30.7 | 588.2 | 0.3 | 6.4 | �
5 | 15.5 | 26.3 | -31.3 | 585.7 | 0.1 | 7.6 | �
6 | 11.2 | 18.4 | -32.0 | 585.1 | 0.1 | 8.3 | �
7 | 13.5 | 20.5 | -33.3 | 584.2 | 0.1 | 8.3 | �
8 | 16.9 | 22.8 | -31.8 | 587.5 | 0.3 | 7.6 | �
Mean | 100.0 | 23.0 | -30.5 | 588.3 | 0.3 | 7.4 |
|
Along the trajectoryCluster
Numb | Temp
(oC/d) | Press
(hPa/d) | H2O
(g/kg/d) | Wspd
(m/s/d) |
|---|
�
1 | 3.72 | 6.53 | 0.22 | 3.62 | �
2 | 3.51 | 8.86 | 0.25 | 2.24 | �
3 | 1.80 | 6.63 | 0.09 | 0.55 | �
4 | -0.49 | 5.51 | 0.02 | 0.58 | �
5 | -5.54 | 5.05 | 0.02 | -0.15 | �
6 | -3.36 | 2.52 | 0.03 | -0.60 | �
7 | 1.57 | 6.03 | 0.11 | 0.54 | �
8 | 3.70 | 7.13 | 0.22 | 3.61 | | | | |
|
Cluster Mean Trajectory File | Means 1980 through 1989 at 70S 120ECluster
Numb | Percent
| Duration
(h) | Temp
(oC) | Press
(hPa) | H2O
(g/kg) | Wspd
(m/s) |
|---|
�
1 | 20.1 | 35.4 | -29.4 | 591.8 | 0.5 | 7.7 | �
2 | 9.9 | 17.5 | -31.4 | 589.5 | 0.3 | 8.0 | �
3 | 19.0 | 24.5 | -32.9 | 586.5 | 0.1 | 7.8 | �
4 | 17.2 | 24.5 | -31.8 | 586.8 | 0.1 | 8.9 | �
5 | 10.0 | 20.0 | -32.7 | 584.7 | 0.1 | 9.3 | �
6 | 10.8 | 21.1 | -32.5 | 586.6 | 0.2 | 7.6 | �
7 | 5.6 | 14.9 | -31.0 | 589.5 | 0.4 | 8.3 | �
8 | 7.3 | 19.2 | -30.0 | 591.4 | 0.4 | 8.5 | �
Mean | 100.0 | 23.4 | -31.5 | 588.3 | 0.2 | 8.2 |
|
Along the trajectoryCluster
Numb | Temp
(oC/d) | Press
(hPa/d) | H2O
(g/kg/d) | Wspd
(m/s/d) |
|---|
�
1 | 3.24 | 8.22 | 0.18 | 1.03 | �
2 | 0.32 | 6.43 | 0.03 | -0.03 | �
3 | -2.48 | 7.32 | 0.01 | 0.03 | �
4 | -5.09 | 4.84 | 0.02 | -1.46 | �
5 | -0.29 | 1.67 | 0.06 | -0.46 | �
6 | 3.14 | 7.28 | 0.18 | 2.47 | �
7 | 4.28 | 6.16 | 0.27 | 4.34 | �
8 | 4.34 | 6.71 | 0.25 | 3.69 | | | | |
|
Cluster Mean Trajectory File | Means 1990 through 1999 at 70S 120ECluster
Numb | Percent
| Duration
(h) | Temp
(oC) | Press
(hPa) | H2O
(g/kg) | Wspd
(m/s) |
|---|
�
1 | 0.4 | 8.6 | -27.2 | 592.4 | 0.7 | 20.0 | �
2 | 9.2 | 19.2 | -31.4 | 588.5 | 0.3 | 9.5 | �
3 | 17.3 | 24.0 | -33.5 | 586.2 | 0.1 | 8.5 | �
4 | 20.1 | 28.8 | -32.6 | 587.7 | 0.2 | 9.1 | �
5 | 15.2 | 28.4 | -32.9 | 586.6 | 0.1 | 9.5 | �
6 | 8.6 | 19.8 | -34.1 | 583.5 | 0.1 | 8.3 | �
7 | 11.4 | 19.7 | -33.1 | 584.9 | 0.2 | 9.3 | �
8 | 17.9 | 28.1 | -31.4 | 588.3 | 0.4 | 9.9 | �
Mean | 100.0 | 24.6 | -32.6 | 586.8 | 0.2 | 9.2 |
|
Along the trajectoryCluster
Numb | Temp
(oC/d) | Press
(hPa/d) | H2O
(g/kg/d) | Wspd
(m/s/d) |
|---|
�
1 | 5.55 | 2.79 | 0.53 | 3.07 | �
2 | 4.20 | 8.17 | 0.23 | 0.50 | �
3 | -2.71 | 7.23 | 0.02 | -0.09 | �
4 | 1.04 | 5.67 | 0.06 | -0.02 | �
5 | -4.12 | 3.90 | 0.03 | -1.52 | �
6 | 1.57 | 4.26 | 0.10 | 1.12 | �
7 | 4.10 | 5.67 | 0.23 | 4.41 | �
8 | 4.60 | 7.37 | 0.27 | 3.32 | | | | |
|
Cluster Mean Trajectory File | Means 2000 through 2009 at 70S 120ECluster
Numb | Percent
| Duration
(h) | Temp
(oC) | Press
(hPa) | H2O
(g/kg) | Wspd
(m/s) |
|---|
�
1 | 21.7 | 27.6 | -30.1 | 588.7 | 0.4 | 10.1 | �
2 | 10.7 | 19.2 | -29.6 | 590.0 | 0.4 | 9.0 | �
3 | 12.5 | 22.6 | -28.7 | 592.2 | 0.4 | 9.0 | �
4 | 10.9 | 20.9 | -30.1 | 590.6 | 0.3 | 9.6 | �
5 | 11.7 | 23.5 | -31.2 | 585.9 | 0.1 | 9.4 | �
6 | 9.1 | 21.6 | -30.5 | 586.6 | 0.1 | 9.6 | �
7 | 5.9 | 14.0 | -32.4 | 584.3 | 0.1 | 9.6 | �
8 | 17.5 | 26.7 | -31.3 | 587.1 | 0.3 | 10.3 | �
Mean | 100.0 | 23.0 | -30.4 | 588.4 | 0.3 | 9.7 |
|
Along the trajectoryCluster
Numb | Temp
(oC/d) | Press
(hPa/d) | H2O
(g/kg/d) | Wspd
(m/s/d) |
|---|
�
1 | 4.47 | 7.12 | 0.28 | 3.65 | �
2 | 3.52 | 7.94 | 0.21 | 0.88 | �
3 | 0.64 | 3.39 | 0.04 | -0.29 | �
4 | -0.18 | 8.59 | 0.04 | -0.01 | �
5 | -5.18 | 5.53 | 0.01 | -0.29 | �
6 | -4.34 | 2.99 | 0.03 | -0.84 | �
7 | 0.15 | 3.29 | 0.07 | 0.48 | �
8 | 3.69 | 4.98 | 0.20 | 3.89 | | | | |
|
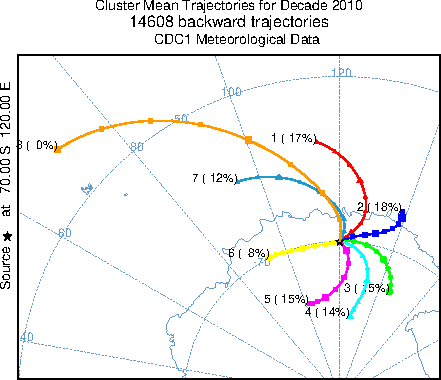
Cluster Mean Trajectory File | Means 2010 through 2019 at 70S 120ECluster
Numb | Percent
| Duration
(h) | Temp
(oC) | Press
(hPa) | H2O
(g/kg) | Wspd
(m/s) |
|---|
�
1 | 16.6 | 23.6 | -30.8 | 588.1 | 0.4 | 11.4 | �
2 | 18.4 | 24.3 | -29.8 | 590.9 | 0.4 | 10.4 | �
3 | 14.8 | 20.4 | -31.4 | 589.4 | 0.3 | 10.5 | �
4 | 13.9 | 19.3 | -32.8 | 587.5 | 0.1 | 10.7 | �
5 | 15.4 | 27.5 | -32.2 | 586.3 | 0.1 | 10.1 | �
6 | 8.2 | 22.8 | -32.9 | 582.6 | 0.1 | 8.8 | �
7 | 12.3 | 20.9 | -32.4 | 586.1 | 0.3 | 10.4 | �
8 | 0.3 | 10.8 | -29.9 | 587.8 | 0.4 | 19.1 | �
Mean | 100.0 | 22.7 | -31.6 | 587.8 | 0.3 | 10.5 |
|
Along the trajectoryCluster
Numb | Temp
(oC/d) | Press
(hPa/d) | H2O
(g/kg/d) | Wspd
(m/s/d) |
|---|
�
1 | 4.96 | 7.39 | 0.27 | 3.62 | �
2 | 3.45 | 6.59 | 0.18 | 0.20 | �
3 | 0.46 | 5.96 | 0.03 | -0.71 | �
4 | -0.91 | 7.78 | 0.03 | -0.22 | �
5 | -4.96 | 6.83 | 0.02 | -1.36 | �
6 | 0.33 | 3.55 | 0.09 | 0.99 | �
7 | 4.32 | 5.33 | 0.21 | 3.95 | �
8 | 6.41 | 4.32 | 0.44 | 5.34 | | | | |
|
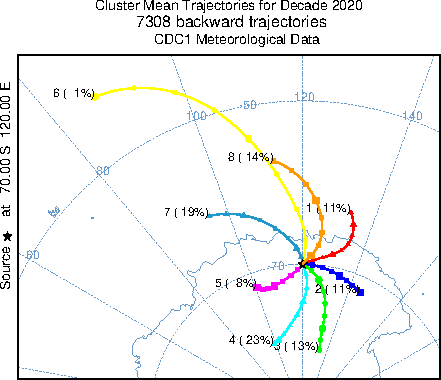
Cluster Mean Trajectory File | Means 2020 through 2025 at 70S 120ECluster
Numb | Percent
| Duration
(h) | Temp
(oC) | Press
(hPa) | H2O
(g/kg) | Wspd
(m/s) |
|---|
�
1 | 8.7 | 16.2 | -28.5 | 590.5 | 0.5 | 9.6 | �
2 | 19.1 | 29.8 | -30.0 | 588.3 | 0.4 | 8.1 | �
3 | 23.9 | 28.6 | -32.3 | 585.2 | 0.1 | 9.1 | �
4 | 20.3 | 30.8 | -30.6 | 588.0 | 0.1 | 9.8 | �
5 | 10.0 | 20.0 | -31.8 | 585.3 | 0.2 | 7.6 | �
6 | 0.8 | 9.7 | -27.2 | 592.8 | 0.7 | 18.8 | �
7 | 12.0 | 18.1 | -30.5 | 588.8 | 0.4 | 8.2 | �
8 | 5.3 | 11.1 | -29.7 | 589.6 | 0.4 | 9.5 | �
Mean | 100.0 | 24.0 | -30.7 | 587.6 | 0.3 | 8.9 |
|
Along the trajectoryCluster
Numb | Temp
(oC/d) | Press
(hPa/d) | H2O
(g/kg/d) | Wspd
(m/s/d) |
|---|
�
1 | 4.63 | 8.22 | 0.26 | 4.10 | �
2 | 3.04 | 6.66 | 0.19 | 1.43 | �
3 | -1.26 | 5.57 | 0.02 | 0.47 | �
4 | -5.18 | 4.29 | 0.02 | -1.76 | �
5 | 1.29 | 5.47 | 0.10 | 0.95 | �
6 | 5.80 | 3.48 | 0.47 | 3.87 | �
7 | 4.04 | 6.59 | 0.22 | 5.01 | �
8 | 4.17 | 5.93 | 0.23 | 4.45 | | | | |
|


